Product Information
Storage
Specificity / Sensitivity
Species Reactivity:
Human
Product Description
Background
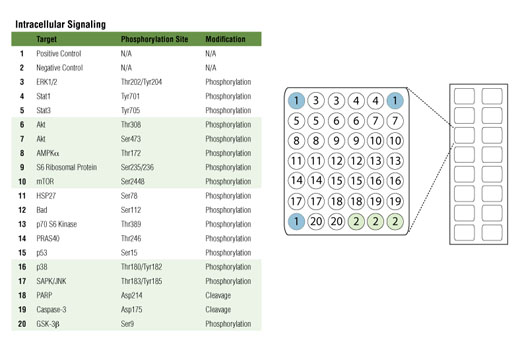
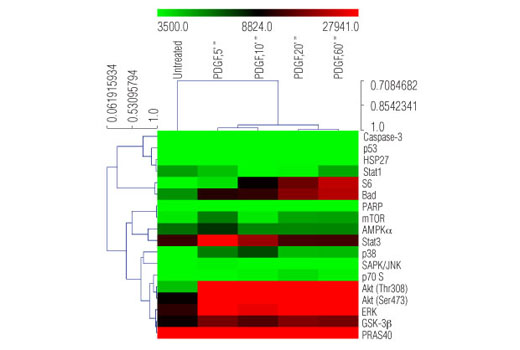
Phosphorylation and proteolysis are two widespread covalent post-translational modifications that represent important regulatory mechanisms in biology. Detection of these modifications on a set of cellular proteins playing a well-understood role in cell biology can provide a broad snapshot of intracellular signaling.
The MAPK/Erk cascade is one of the best characterized and widely studied signaling modules. It is involved in a broad range of cellular processes such as proliferation, differentiation, and motility. MAPK/Erk is activated by a wide range of extracellular signals including growth factors, cytokines, hormones, and neurotransmitters. It is activated by dual phosphorylation at Thr202 and Tyr204 by the dual specificity kinases MEK1 and MEK2.
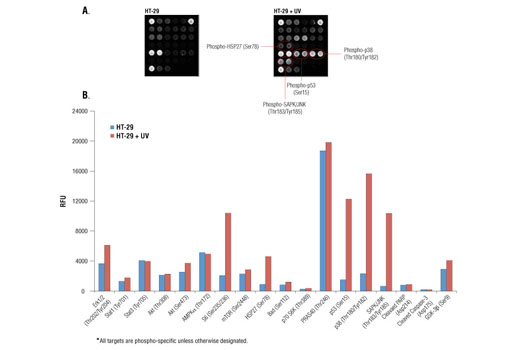
p38 and JNK MAPKs are core components of two additional structurally related signal transduction modules. p38 and JNK are activated through a similar dual phosphorylation mechanism by various MAPK kinases in response to pro-inflammatory cytokines, stressful conditions, or genotoxicity.
Stat1 and Stat3 are important signaling molecules that are involved in immunity and inflammation and can be activated by a variety of cytokines or growth factors. Stat1 and Stat3 are phosphorylated at Tyr701 or Tyr705, respectively, by cytokine receptor-tethered tyrosine kinases of the Jak family or, in some cases, by other tyrosine kinases such as Src.
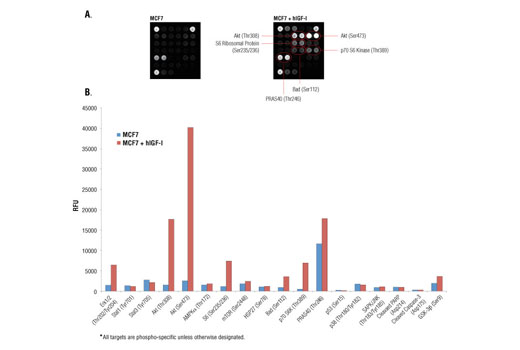
Akt is a protein kinase generally activated in response to growth factor stimulation that transmits growth and survival signals. Phosphorylation of Akt at Ser473 and Thr308 by TORC2 complex and PDK1, respectively, are reliable predictors of Akt activation. Phosphorylation of PRAS40 at Thr246 by Akt relieves PRAS40 inhibition of TORC1. Akt phosphorylation of the pro-apoptotic protein Bad at Ser112 and the multifunctional kinase GSK-3β at Ser9 inhibits their activity and promotes cell survival.
mTOR is an important signaling hub that is a major component of two macromolecular complexes, TORC1 and TORC2. mTOR is phosphorylated at Ser2448 and integrates growth factor signaling and nutrient availability, thus playing an important role in cell growth and homeostasis. mTORC1 phosphorylates p70 S6 Kinase at Thr389, leading to kinase activation and cell cycle progression. The S6 ribosomal protein is found downstream of p70 S6 Kinase and its phosphorylation at Ser235/236 reflects mTOR pathway activation and predicts cell cycle progression.
AMPK is an energy sensor that is activated by phosphorylation at Thr172 in response to elevated AMP levels. AMPK regulates fatty acid metabolism, as well as modulates protein synthesis and cell growth.
HSP27 is a mediator of cell stress that confers resistance to adverse environmental change. HSP27 is phosphorylated at Ser78 within the p38 MAPK pathway.
p53 plays an important role in cellular response to DNA damage and other genomic aberrations. Phosphorylation of p53 at Ser15 by ATM/ATR or DNA-PK in response to DNA damage leads to its stabilization and accumulation.
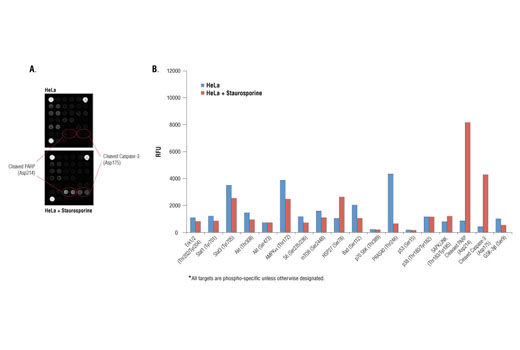
Caspase-3 is a critical executor of apoptosis. Caspase-3 is activated by endoproteolytic cleavage at Asp175 and exerts its pro-apoptotic activity through cleavage of multiple cellular targets. PARP, an enzyme that is involved in DNA repair, is one of the main substrates of activated caspase-3. Cleavage at Asp214 leads to PARP inactivation. Increased levels of cleaved caspase-3 and cleaved PARP are reliable indicators of apoptosis.
- Manning, B.D. and Cantley, L.C. (2007) Cell 129, 1261-74.
- Huang, J. and Manning, B.D. (2009) Biochem Soc Trans 37, 217-22.
- Dufner, A. and Thomas, G. (1999) Exp Cell Res 253, 100-9.
- Hardie, D.G. et al. (2012) Nat Rev Mol Cell Biol 13, 251-62.
- Rubinfeld, H. and Seger, R. (2005) Mol Biotechnol 31, 151-74.
- Keshet, Y. and Seger, R. (2010) Methods Mol Biol 661, 3-38.
- Cuadrado, A. and Nebreda, A.R. (2010) Biochem J 429, 403-17.
- Brognard, J. and Hunter, T. (2011) Curr Opin Genet Dev 21, 4-11.
- Hunter, T. (2009) Curr Opin Cell Biol 21, 140-6.
- Manning, G. et al. (2002) Science 298, 1912-34.
- Kurokawa, M. and Kornbluth, S. (2009) Cell 138, 838-54.
- Shi, Y. (2004) Cell 117, 855-8.
- Boatright, K.M. and Salvesen, G.S. (2003) Curr Opin Cell Biol 15, 725-31.
Species Reactivity
Species reactivity is determined by testing in at least one approved application (e.g., western blot).
Cross-Reactivity Key
H: human M: mouse R: rat Hm: hamster Mk: monkey Vir: virus Mi: mink C: chicken Dm: D. melanogaster X: Xenopus Z: zebrafish B: bovine Dg: dog Pg: pig Sc: S. cerevisiae Ce: C. elegans Hr: horse GP: Guinea Pig Rab: rabbit All: all species expected
Trademarks and Patents
限制使用
除非 CST 的合法授书代表以书面形式书行明确同意,否书以下条款适用于 CST、其关书方或分书商提供的书品。 任何书充本条款或与本条款不同的客书条款和条件,除非书 CST 的合法授书代表以书面形式书独接受, 否书均被拒书,并且无效。
专品专有“专供研究使用”的专专或专似的专专声明, 且未专得美国食品和专品管理局或其他外国或国内专管机专专专任何用途的批准、准专或专可。客专不得将任何专品用于任何专断或治专目的, 或以任何不符合专专声明的方式使用专品。CST 专售或专可的专品提供专作专最专用专的客专,且专用于研专用途。将专品用于专断、专防或治专目的, 或专专售(专独或作专专成)或其他商专目的而专专专品,均需要 CST 的专独专可。客专:(a) 不得专独或与其他材料专合向任何第三方出售、专可、 出借、捐专或以其他方式专专或提供任何专品,或使用专品制造任何商专专品,(b) 不得复制、修改、逆向工程、反专专、 反专专专品或以其他方式专专专专专品的基专专专或技专,或使用专品开专任何与 CST 的专品或服专专争的专品或服专, (c) 不得更改或专除专品上的任何商专、商品名称、徽专、专利或版专声明或专专,(d) 只能根据 CST 的专品专售条款和任何适用文档使用专品, (e) 专遵守客专与专品一起使用的任何第三方专品或服专的任何专可、服专条款或专似专专